One of the finest techniques to check the generalization power of a machine learning model is to use Cross-validation techniques. Cross-validation refers to a set of methods for measuring the performance of a given predictive model. It can be computationally expensive, because they involve fitting the same model multiple times using different subsets of the training data. Cross-validation techniques generally involves the following process:
-
Divide the available data set into two sets namely training and testing (validation) data set.
-
Train the model using the training set
-
Test the effectiveness of the model on the reserved sample (testing) of the data set and estimate the prediction error.
cross-validation methods for assessing model performance includes,
     Validation set approach (or data split)
     Leave One Out Cross Validation
     k-fold Cross Validation
     Repeated k-fold Cross Validation
Validation Set Approach
The validation set approach involves
 1.  randomly dividing the available data set into two parts namely,  training data set and validation data set.

 2.  Train the model on the training data set

 3.  The Trained model is then used to predict observations in the validation   set to test the generalization

   ability of  the model when faced with new observations by calculating the prediction error.
Let now import the needed packages for the tutorial
from sklearn.preprocessing import StandardScaler
from sklearn.model_selection import train_test_split,LeaveOneOut,KFold,RepeatedKFold
import numpy as np
from sklearn.linear_model import LinearRegression
from sklearn.svm import SVR
from sklearn.model_selection import cross_val_score
from sklearn.metrics import make_scorer,mean_squared_error,r2_score
import sklearn
import pandas as pd
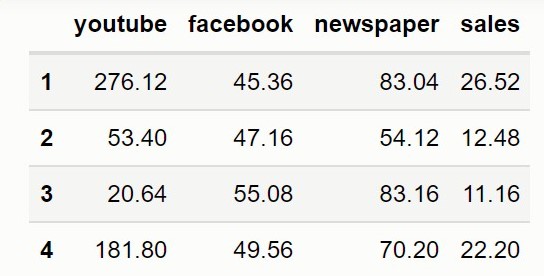
The code below Loads the data to be used
marketing=pd.read_csv('data/marking.csv',index_col=0)
print("The advertising datasets has "+
      str(marketing.shape[0])+ ' observations and '+str(marketing.shape[1])+' features')
The advertising datasets has 200 observations and 4 features
displaying the first four instances or observations of the dataset
marketing.head(4)
Feature Scaling or transformation
Numerical features are often measured on different scales and this variation in scale may pose problems to modelling the data correctly. With few exceptions, variations in scales of numerical features often lead to machine Learning algorithms not performing well. When features have different scales, features with higher magnitude are likely to have higher weights and this affects the performance of the model.
Feature scaling is a technique applied as part of the data preparation process in machine learning to put the numerical features on a common scale without distorting the differences in the range of values. There are many feature scaling techniques such as
    Min-max scaling (normalization),

    Box-Cox transformation,

    Mean normalization
etc, but We will discuss only Standardization(Z-score)
Standardization(Z-score)
When Z-score is applied to a feature this makes the feature have a zero mean by subtracting the mean of the feature from the data points and then it divides by the standard deviation so that the resulting distribution has unit variance.
Standardization.
\[x_{z-score}= \frac{x-\bar{x}}{ \sigma}\]since all features in our dataset are numerical we will scale them using Z-score
Note: the target values is generally not scaled
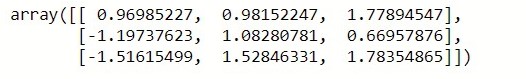
scale=StandardScaler()
features=scale.fit_transform(marketing.iloc[:,:3])
features[0:3]
The code below splits the data into training and testing set with 70% of the instances in the training set and 30% in the testing set
X_train, X_test, y_train, y_test=train_test_split(features,marketing.iloc[:,-1],
                                                  test_size=0.3,random_state=50)
Let now fit a linear regression model to the dataset
lrg=LinearRegression()
lrg.fit(X_train,y_train)
we now test the trained model on the testing set
lrg_predictions=lrg.predict(X_test)
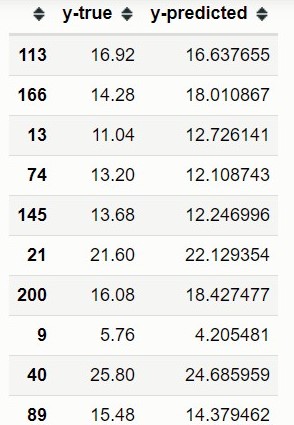
Let now convert the actual y-values of the testing set and the model predicted values for the testing set into a dataframe and print the first 10 to see how close the predicted y-values are to that of the actual y-values
compare=pd.DataFrame({"y-true":y_test,"y-predicted":lrg_predictions})
compare.head(10)
The code below calculates the mean square error (MSE), root mean square error (RMSE) and the R-Squre of the model based on the test set
MSE_lrg=mean_squared_error(y_pred=lrg_predictions,y_true=y_test)
RMSE=np.sqrt(MSE_lrg)
R2=r2_score(y_pred=lrg_predictions,y_true=y_test)
R2,MSE_lrg,RMSE
(0.8590575550977458, 3.776792977082013, 1.9433972772138004)
NOTE
the validation set approach is only useful when a large data set is available. The model is trained on only a subset of the data set so it is possible the model will not be able to capture certain patterns or interesting information about data which are only present in the test data, leading to higher bias. The estimate of the test error rate can be highly variable, depending on precisely which observations are included in the training set and which observations are included in the validation set.
LEAVE ONE OUT CROSS VALIDATION- LOOCV
LOOCV is a special case of K-cross-validation where the number of folds equals the number of instances in the data set. It involves splitting the date set into two parts. However, instead of creating two subsets of comparable size, only a single data point is reserved as the test set. The model is trained on the training set which consist of all the data points except the reserved point and compute the test error on the reserved data point. It repeats the process until each of the n data points has served as the test set and then average the n test errors.
Let now implement LOOCV
Y=np.array(marketing.iloc[:,-1])

loocv_obj=LeaveOneOut()
error=[]
for train_idx,test_idx in loocv_obj.split(features):
    X_train=features[train_idx]
    y_train=Y[train_idx]
    X_test=features[test_idx]
    y_test=Y[test_idx]
    lrg1=LinearRegression()
    lrg1.fit(X_train,y_train)
    pred=lrg1.predict(X_test)
    MSE=mean_squared_error(pred,y_test)
    error.append(MSE)
np.mean(error),np.sqrt(np.mean(error))
(4.2435357128200835, 2.059984396256458)
OR
lrg1=LinearRegression()
loocv=LeaveOneOut()
mse=make_scorer(mean_squared_error)
scores=cross_val_score(lrg1,features,Y,scoring=mse,cv=loocv)

print("Folds: " + str(len(scores)) + ", MSE: " + str(np.mean(scores)) +
      ", RMSE: " + str(np.sqrt(np.mean(scores))))
Folds: 200, MSE: 4.2435357128200835, RMSE: 2.059984396256458
Although in LOOCV method, we make use all data points reducing potential bias, it is a poor estimate because it is highly variable, since it is based upon a single observation especially if some data points are outliers and has higher execution time when n is extremely large.
K-Fold Cross-Validation
In practice if we have enough data, we set aside part of the data set known as the validation set and use it to measure the performance of our model prediction but since data are often scarce, this is usually not possible and the best practice in such situations is to use K-fold cross-validation.
K-fold cross-validation involves
- Randomly splitting the data set into k-subsets (or k-fold)
- Train the model on K-1 subsets
- Test the model on the reserved subset and record the prediction error
- Repeat this process until each of the k subsets has served as the test set.
- The average of the K validation scores is then obtained and used as the validation score for the model and is known as the cross-validation error .
cv4=KFold(n_splits=4)
scores = cross_val_score(lrg1, features,Y, scoring="neg_mean_squared_error",
                        cv=cv4,n_jobs=1)
print("Folds: " + str(len(scores)) + ", MSE: " + str(np.mean(np.abs(scores))) +
       ", RMSE: " + str(np.sqrt(np.mean(np.abs(scores)))))
Folds: 4, MSE: 4.280873800694743, RMSE: 2.0690272595339927
REPEATED K-FOLD CROSS-VALIDATION
The process of splitting the data into k-folds can be repeated a number of times, this is called repeated k-fold cross validation.
number -the number of folds
repeats For repeated k-fold cross-validation only: the number of complete sets of folds to compute
r2cv4 = RepeatedKFold(n_splits=4, n_repeats=2, random_state=40)
scores = cross_val_score(lrg1, features,Y, scoring="neg_mean_squared_error",
                          cv=r2cv4 ,n_jobs=1)
print("Folds: " + str(len(scores)) + ", MSE: " + str(np.mean(np.abs(scores))) +
       ", RMSE: " + str(np.sqrt(np.mean(np.abs(scores)))))
Folds: 8, MSE: 4.2380837495395145, RMSE: 2.0586606688669007
References:
Gareth James, Daniela Witten, Trevor Hastie and Robert Tibshirani. An Introduction to Statistical Learning with Applications in R.</a>