This tutorial illustrate how to filter a table using the FILTER function in DAX. Whether you are a data scientist, a marketing or sales person, filtering data is one of the most common ways you analyze data. The FILTER function is often used to filter rows of a table reducing the size of the table. When table is filtered, the resulting data is a subset of table and this presents an opportunity to prepare for future analysis.
The syntax of FILTER is given as:
FILTER ( <table>, <condition> )
Using this syntax FILTER receives a table and a logical condition as parameters. In order to return a result, it iterates the table evaluating the condition on a row-by-row basis and returns all rows satisfying the condition.
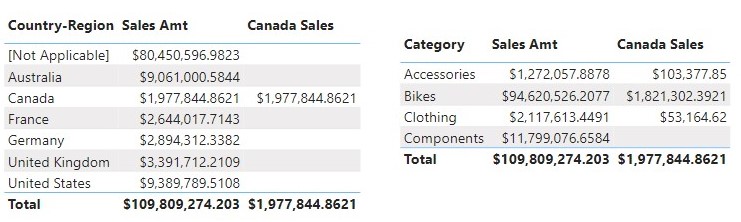
Let now create a measure Canada Sales that finds the amount of sales from Canada
Canada Sales = CALCULATE(
                        Sales[Sales Amt],
                        FILTER(
                                Customer,
                                Customer[Country-Region]="Canada"
                              )
                      )
Result from the Canada Sales measure shows only sales where Customers are from or in Canada
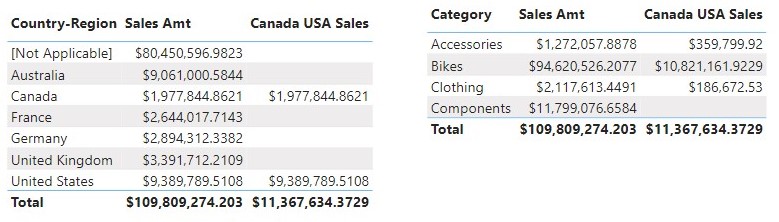
Let create another measure Canada USA Sales that filter the table to return sales where a customer is either from Canada or United States,
Canada USA Sales = CALCULATE(
                            Sales[Sales Amt],
                            FILTER(
                                    Customer,
                                    Customer[Country-Region]="Canada" || Customer[Country-Region]="United States"
                                    )
                            )
Result from the Canada USA Sales measure shows only sales where Customers are from either Canada OR United States
Conclusion
The filter function is a simple Power BI function that allows you to iterate table on a row-by-row basis and returns all rows satisfying the condition specified.