In this post I will be detailing how to use DAX RANKX function. Ranking is one of the most commonly used calculations in Power BI reports. In Many reports products, countries and many more are usually ranked based on certain measures such as their revenue volumes to determine their ranking positions and to get a better view of the products and countries from which the company is getting more revenue or sales from and RANKX is a DAX function that can used for ranking.
RANKX function is an iterator that is used to show the ranking value of an element according to a specific sort order. It returns the ranking of a number in a list of numbers for each row in the table argument. As and iterator it requires at least two parameters, the table that it scans and an expression that is evaluated for each row of the table. It has the syntax below,
RANKX(<table>, <expression>[, <value>[, <order>[, <ties>]]])
From the syntax the table and expression parameters are the required parameters. The rest are optional.
table
The first parameter <table> requires table as input. The table can be a standard table that you imported into Power BI or any DAX expression that returns a table of data over which the expression is evaluated.
expression
The expression parameter can be thought of as “Sort by” instruction for the RANKX function. It is the expression upon which the ranking is calculated based on it. The expression is evaluated for each row of table, to generate all possible values for ranking. It can be any DAX expression that returns a single scalar value.
value
(Optional) Any DAX expression that returns a single scalar value whose rank is to be found. When the value parameter is omitted, the value of expression at the current row is used instead.
order
The order parameter is an optional parameter that allows you to swap the ranking between ASC (ascending) or DESC (descending). DESC is the default value when the order parameter is omitted.
ties
(Optional) An enumeration that defines how to determine ranking when there are ties. This argument can be either Skip (default value) or Dense. When set to Dense, the function doesn’t skip numbers for tied ranks.
Practical Examples
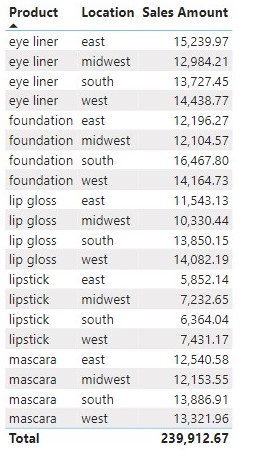
In this example I will be using sales data for a small makeup company as shown below,
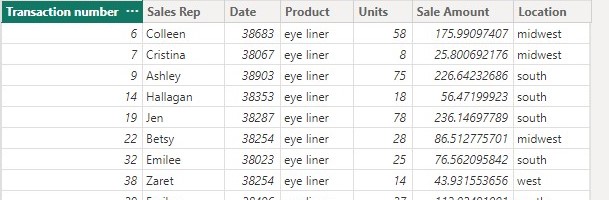
As member of the data analyst team we have been tasked by the manager to rank the sales representatives (sale reps for short) based on their related sales amount given below, because he wants to know the best performing sale reps in the company.
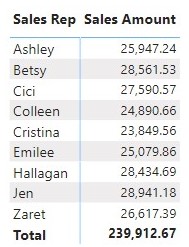
To rank sale reps the ranking computation is performed by the code below
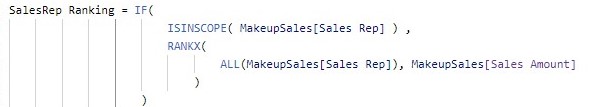
The use of ISINSCOPE is to avoid showing a value at the grand total level.
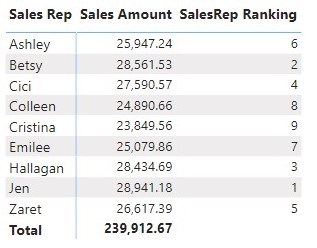
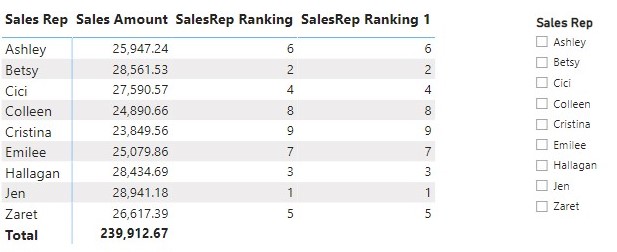
The ALL function ignores any filters that might have been applied and returns all the rows in a table, or all the values in a column. With the ranks computed, when used in a matrix visual will produce the result is given below
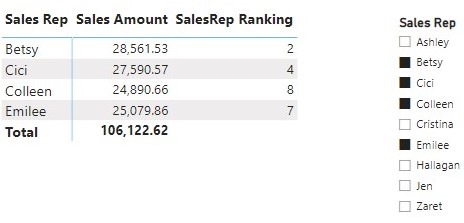
In the presence of slicers that reduce the number of sale reps visible to the matrix because ALL function ignores any filter in the report, the rank of a selected sale rep will be the same as his/her rank in the ranking of all sale reps as shown below
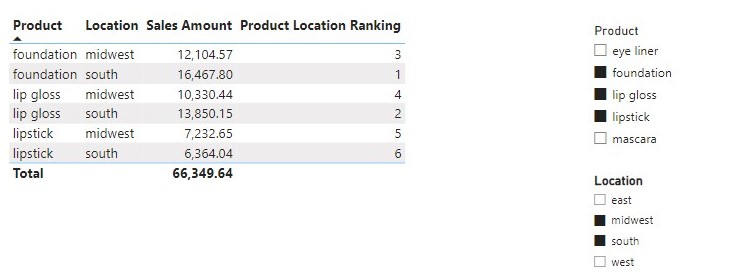
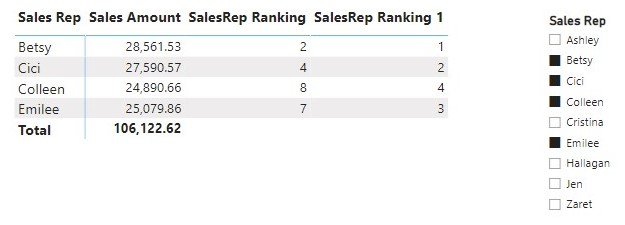
Instead of ALL we can use ALLSELECTED. ALLSELECTED guarantees a better behavior in the presence of slicers that reduce the number of sale reps visible to the matrix. It removes context filters from columns and rows in the current query, while retaining all other context filters or explicit filters. The ranking will automatically update depending on the selection in the slicer.
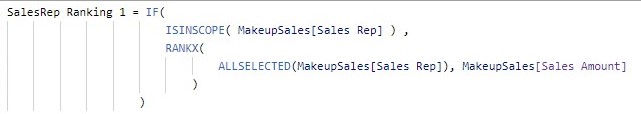
Using the code in a matrix visual produce the result below
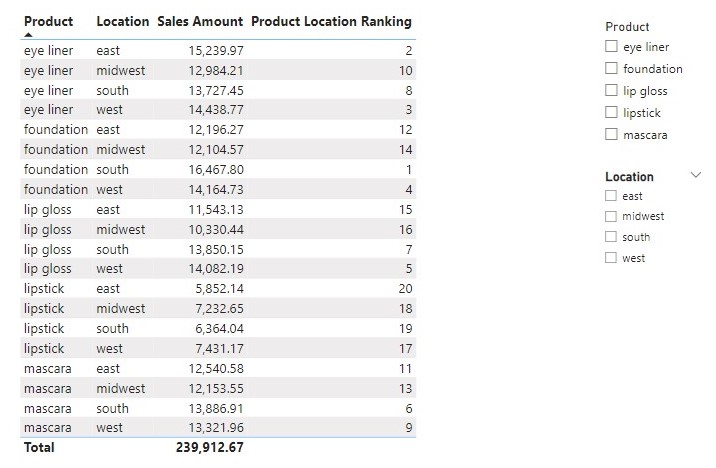
With the sale reps ranked, the manager has now decided that he wants to know the products to send to the various locations so he has tasked the data analyst team to rank the products in combination with the locations based on their related sales Amount.
The code for the ranking is given below
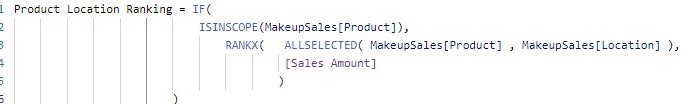
When used in a matrix visual will produces the results below