In this blog, I’ll dive into time-related calculations in DAX with hands-on experience. Time intelligence relates to calculations over time. These calculations enable users to manipulate data using time periods such as weeks, months, quarters and years. They accumulate values from the beginning of a time period such as year, quarter, month and build and compare calculations over those periods. Time-intelligence functions modify the date filter context, and understanding these functions is very important to developing a range of date-related calculations that help in answering questions such us
- What is the accumulated sales for the year, quarter, or month?
- Want to compare this month sales to that of last month?
- Is there any increase or decrease in sales in the current month compared to sales of the same period (month) in the previous year?
- What is the year-to-date costs?
DAX includes several time intelligence functions concerned with standard date periods, specifically years, quarters, and months to simplify such calculations but you can also write custom time intelligence formulas using the CALCULATE function. There are many different calculations that DAX has no predefined functions for your requirements so you cannot expressed these calculations by simply using standard DAX time intelligence functions. In this case you need to write custom time intelligence function to modify the date filters.
In order to use any time intelligence function, you need a date table satisfying the following requirements:
- The date table in your model must contain a column with a Date/Time or Date data type known as the date column containing unique values.
- The date column must not contain blanks or any missing dates. For a Gregorian calendar year the Date table must always start on January 1 and end on December31, including all the dates in this range. If the report only references fiscal years, then the date table must include all the dates from the first to the last day of a fiscal year.
These requirements are useful to perform any time intelligence calculation.
Sample Data
To work through the examples in this article, you’ll need to download the data from Adventure Works DW 2020 M07.pbix as shown below
With the data downloaded let now make our hands dirty by going through some examples. Time intelligence functions support calculations to aggregate and compare data so in this post I will look at two groups of DAX time intelligence functions namely a group concerned with
- Summarizations over time.
- Comparisons over time.
Before exploring these functions let add a calculated column named Year to the date table using the code below
Year = YEAR('Date'[Date])
Summarizations over time
This group of DAX time intelligence functions are concerned with summarizations or aggregation of data over time such as computing period-to-date totals.
exploring Year-to-date total
Let’s start the example with a simple function to calculate year to date. Year-to-date (YTD) total aggregates data starting on the first day of the fiscal or calendar year up to the last date in the Specified date. To illustrate how YTD calculation works let create a YTD measure for the calendar year called YTD Sales C using CALCULATE and DATESYTD functions.
YTD Sales C = CALCULATE(Sales[Sales Amt],DATESYTD('Date'[Date]))
DATESYTD returns the set of dates for the year to date visible in the filter context and is given by
DATESYTD(<dates> [,<year_end_date>])
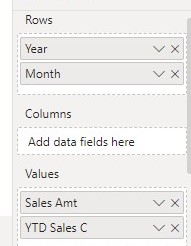
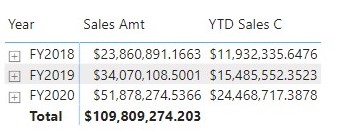
where year_end_date is optional parameter that defines the year-end date with December 31 as it default date. With the YTD total for the calendar year measure created, let now create a matrix visual with rows and values as below
This will produce the result below for the calendar years.
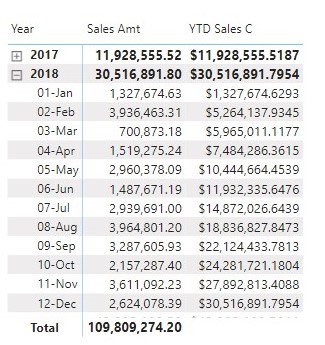
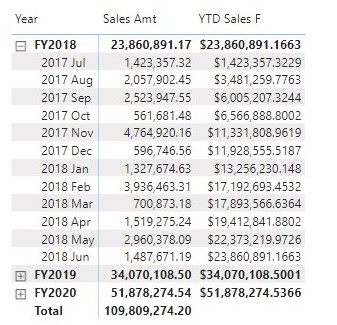
Using YTD sales for the calendar year (YTD Sales C) to compute the YTD sales for the fiscal year will produce inaccurate result if the report is based on a fiscal year that does not correspond to the calendar year that is the fiscal year starts on a different date other than January 1. An example of such inaccurate result is shown below.
We can see from the above matrix that since the fiscal year has a different starting date (July 1) from that of the calendar year (January 1), this produce inaccurate results. To produce the right values for the fiscal YTD total if the fiscal year that does not correspond to the calendar year then the DATESYTD function requires an additional argument to identify the last day of the fiscal year. Since the fiscal year end on June 30 (“6-30”) I will now create a YTD sales measure for the fiscal year called YTD Sales F by the code below
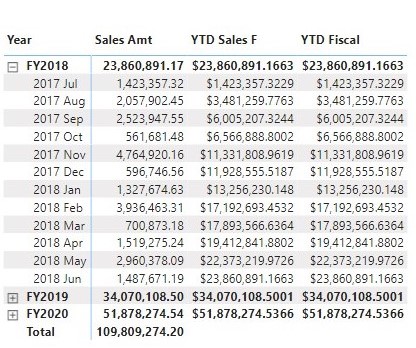
YTD Sales F = CALCULATE(Sales[Sales Amt], DATESYTD('Date'[Date],"6-30") )
Using a matrix visual will produce the result below
The YTD calculation can be simplified by using DAX TOTALYTD function which is given by
TOTALYTD(<expression>,<dates>[,<filter>][,<year_end_date>])
Using TOTALYTD to create a YTD measure for the fiscal year named YTD Fiscal will be
YTD Fiscal = TOTALYTD(
                        Sales[Sales Amt],
                        'Date'[Date],
                        "6-30"
                        )
This will produce the result below
Quarter-to-date total
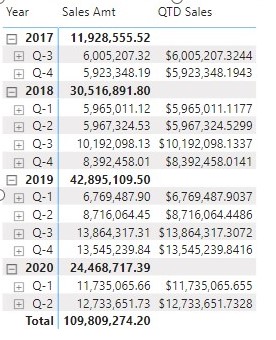
Similar to YTD, quarter to date (QTD) total aggregates data from the first day of the first month of the quarter to the last day of the last month of the quarter and can be computed using CALCULATE and DATESQTD functions. Let create a measure named QTD Sales for the QTD total sales as follows
QTD Sales = CALCULATE(Sales[Sales Amt],DATESQTD('Date'[Date]))
Using a matrix visual the QTD calculation will produce the result below
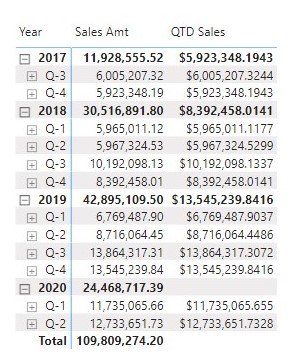
From the above matrix visual we can see that QTD Sales display the QTD total sales of the fourth quarter as the total sales for the year. To remove this inaccurate results from the matrix visual I will write a conditional expression using the IF function together with ISINSCOPE to avoid showing a value at the year level. Using these functions the QTD total sales will be as follows
QTD Sales = IF( ISINSCOPE('Date'[QUATER]) ,
                 CALCULATE( Sales[Sales Amt],
                            DATESQTD('Date'[Date])
                            )
                  )
and will produce the result below
The QTD total calculation can also be simplified using TOTALQTD function which is given as
TOTALQTD(<expression>,<dates>[,<filter>])
Month-to-date total
The month to date (MTD) aggregates data from the first day to the last day of the month and can be computed as below
MTD Sales = IF(
                HASONEFILTER('Date'[Month]),
                 CALCULATE(  Sales[Sales Amt],
                             DATESMTD('Date'[Date])
                            )
                )
The MTD total computation can also be simplified using TOTALMTD function.
Comparisons over time.
When working with dates, One common types of analysis that we usually perform when working with dates is to compare time periods such as comparing sales in the current month or year with the previous month or year which can be useful for making comparisons of trends. Let now explore time intelligence examples under comparison over time.
Year-Over-Year calculation
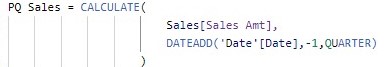
Year-over-year (YOY) compares a period to the equivalent period in the previous year. It compute the difference between a measure and its value in the previous year. In this post I will calculate the YOY growth as an amount in Sales. To calculate the YOY sales I will first create a measure named PY Sales which calculate the sales of the previous year using the DATEADD function as follows.
PY Sales = CALCULATE(
                      Sales[Sales Amt],
                      DATEADD('Date'[Date],-1,YEAR)
                      )
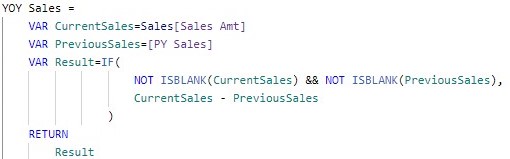
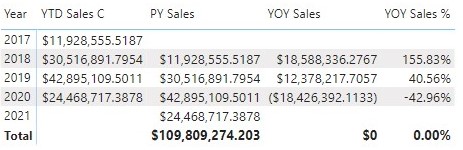
With PY Sales measure computed I will now compute YOY as an amount in Sales named YOY Sales which is the difference between sales in the current year and that of the previous year. The code below only shows values for which both the current and previous sales are available.
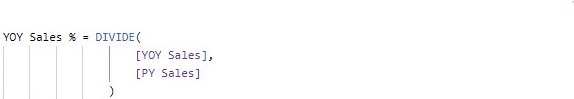
I will express the YOY Sales as a as a percentage named YOY Sales % by dividing YOY Sales by PY Sales.
Substracting the PY Sales from the Sales Amount (YTD Sales) and using the PY Sales as a reference for the percentage difference indicate that a 100 percent corresponds to a value that has doubled in a year and 100+ percent indicate a value which is more than doubled in a year.
Using a matrix visual the PY Sales, YOY Sales and YOY Sales % will produce the result below
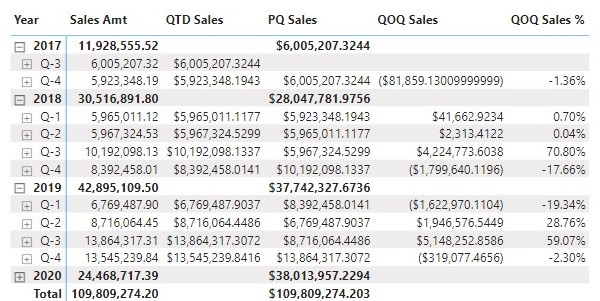
Quarter-Over-Quarter calculation
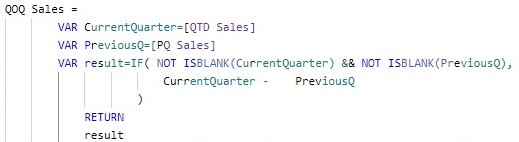
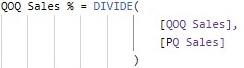
Similar to YOY calculation, Quarter-over-quarter calculation compares the value of each quarter with the value of the quarter before. Under QOQ calculation I will create a measures named PQ Sales which computes sales of the previous quarter, QOQ Sales which is the difference between sales in the current (this) quarter QTD Sales and that of the previous quarter (the quarter before the current quarter) PQ Sales and QOQ Sales % which expresses QOQ Sales as a percentage of the previous quarter.
Using a matrix visual the PQ Sales, QOQ Sales and QOQ Sales % will produce the result below
Month-Over-Month calculation
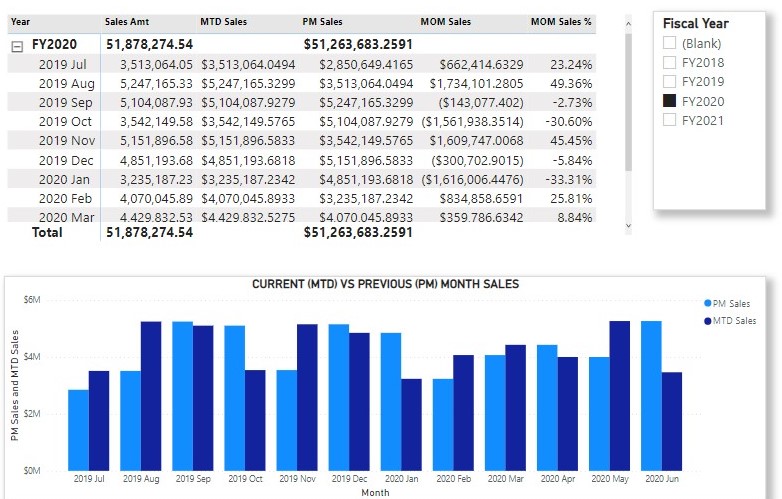
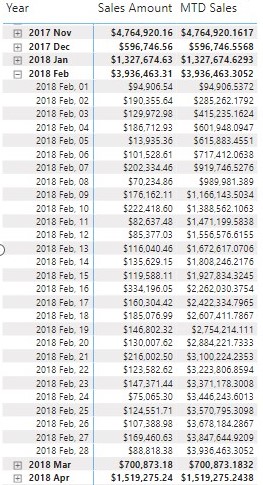
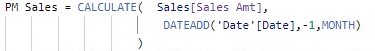
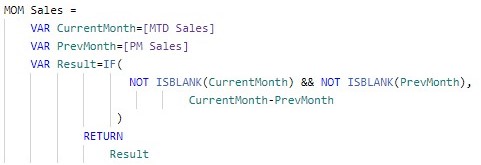
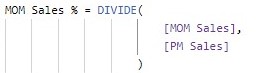
A similar approach can be used for the month-over-month calculation which compares the value of each month with the value of the month before. Under the MOM calculation I will also create measures named PM Sales which computes sales of the previous month, MOM Sales which is the difference between sales in the current month (MTD Sales or Sales Amt) and that of the previous Month PM Sales and MOM Sales % which expresses MOM Sales as a percentage of the previous month.
With these calculation let now compares the sales in each month (MTD Sales) of 2020 with the sales of the month before (PM Sales). Note the 2020 fiscal year start on July 1, 2019.