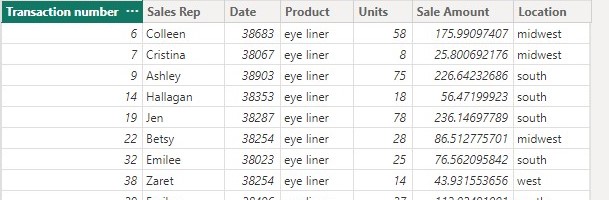
In this post I will be detailing how to use the Group By transformation to summarize data in Power Query. The Group By operation summarizes data by aggregating rows based on one or more columns. To illustrate the steps involved in using Group By need data of which we will be working with and so in this post I will be using sales data from a small makeup company shown below,
To perform any grouping using the Group By operation we first need to know where to find the Group By button. The Group by button can be found in three places:
1. First select a column within the data, right-click and select Group By.
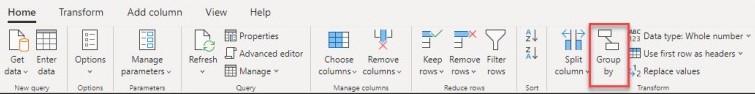
2. It can also be found in the Transform group On the Home tab.
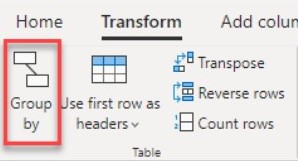
3. And on the Transform tab, in the Table group.
With the data provided and the location of the Group By button found, our first task is to summarize the total amount of sales obtained from the sale of a product at a specific location. In other words we want the total amount of sales obtained by selling a product at a specific location so we’ll use the Product and Location columns to perform the group by operation. To find the solution to our task by using Group By transformation,
1. First in the Transform group On the Home tab select Group By which will open the Group By dialog box as shown below.
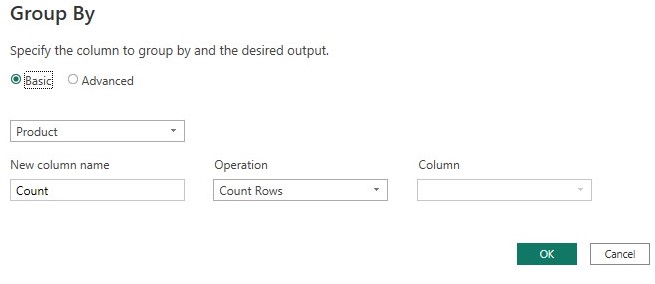
Here if product column is not selected then change the column selected to the product column
2. Select the Advanced option, so you can select multiple columns to group by.
3. Select Add grouping.
4. Select the Location column.
5. In New column name, enter Total Sales, in Operation, select Sum, and in Column, select Sale Amount as shown below.
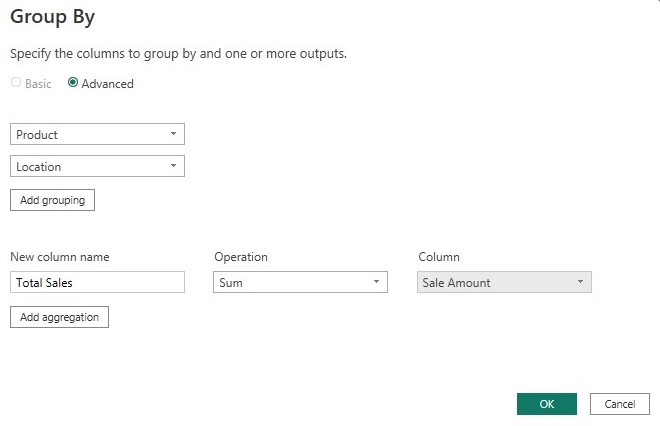
6. Select OK
After selecting ok the operation produce the following table
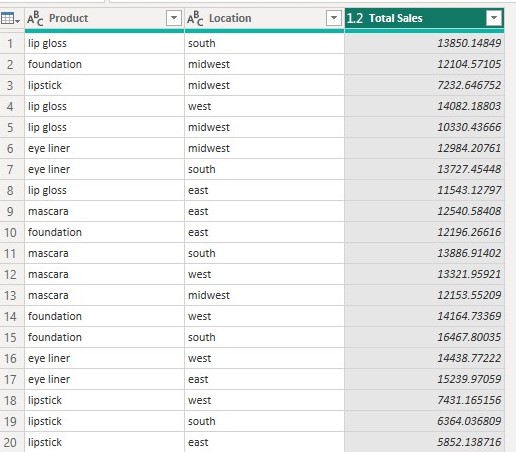
The Group by result produced is one record per each unique combination of all fields set in the “group by ” section.
With task 1 completed let now move a step further to find for each total sales of product sold at a specific location, the maximum sale amount of the product and it related sales rep. To edit the Group By dialog box in the Query Settings pane, under APPLIED STEPS as shown below
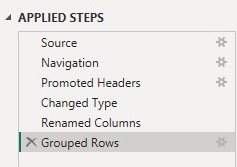
Right click on the Grouped Rows step and select Edit Settings
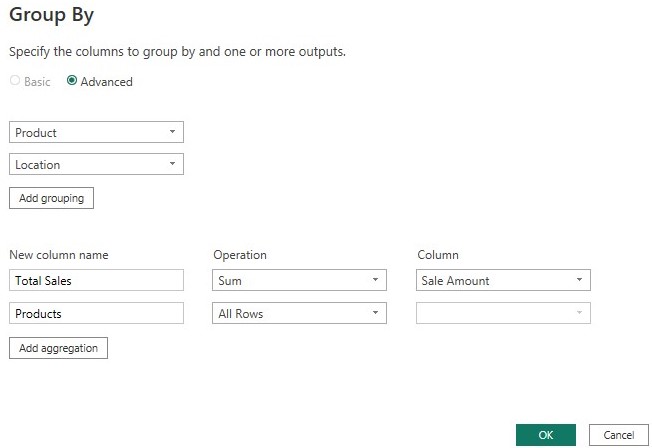
Now click on Add aggregation
In New column name, enter Products, in Operation, All Rows.
A Row Operation does not require a column (that is why column under All Rows operation is empty), because data is grouped by a row in the Group By dialog box
Select OK
This operation produce the following table
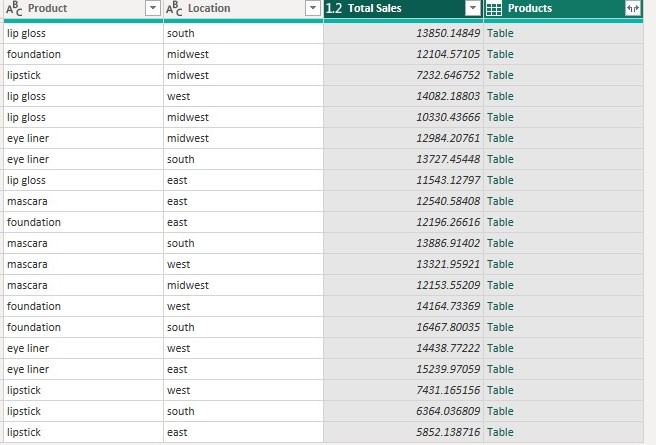
With All Rows An inner Table value is inserted which contains all the rows that were grouped by the Product and Location columns from your original table, so notice how the Products column has [Table] values inside each cell. You can later expand the columns if you want.
Extraction of top performer product information
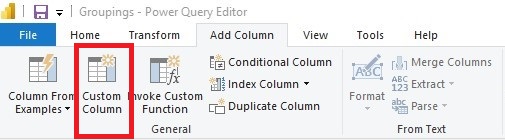
With the new Products column with [Table] values, let now create a custom column named Top performer product. To create a custom column named Top performer product
1. Click on the Add Column tab on the ribbon
2. From the General group select Custom Column
3. Name your new column name Top performer product and enter the formulaTable.Max([Products], "Sale Amount" ) under Custom column formula.
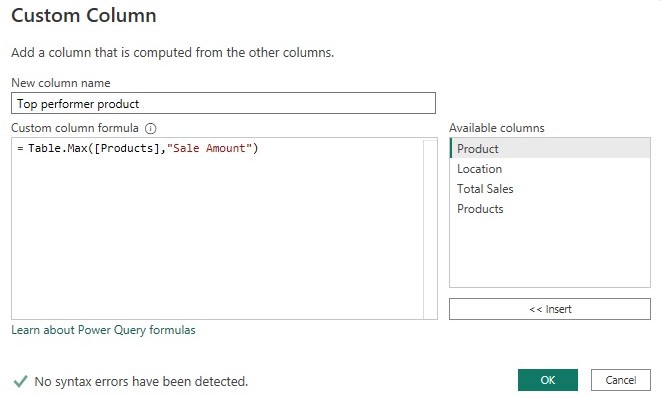
Select Ok.
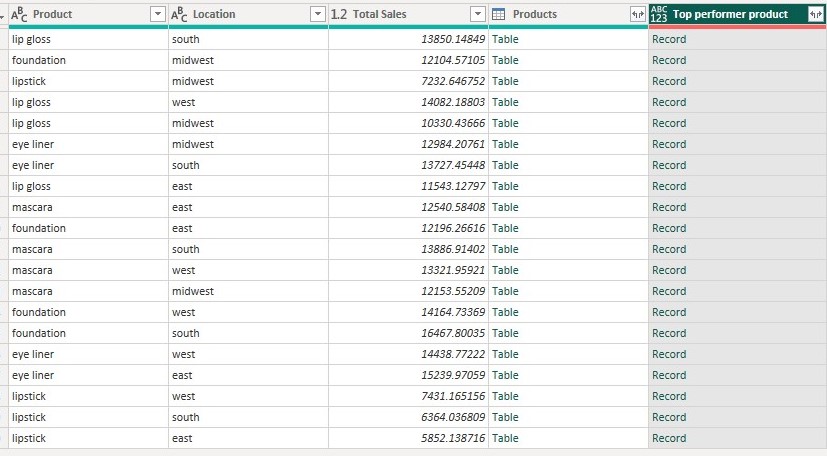
With ok selected, it creates a new column named Top performer product with [Record] values.
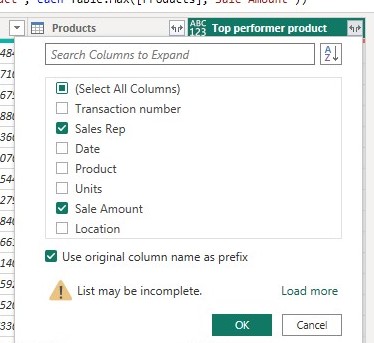
With the Top performer product column created, select the expand icon and select the Sale rep and Sale Amount fields, and then click OK
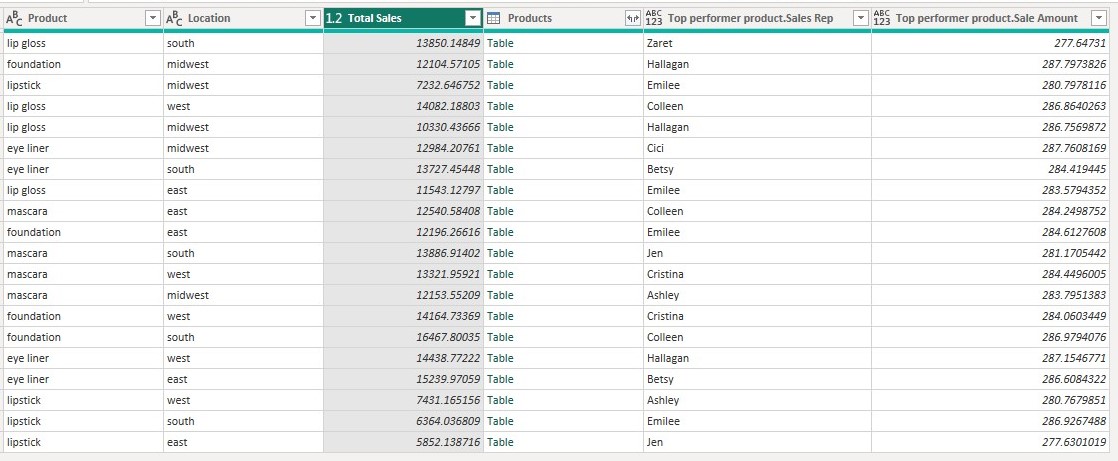
After clicking ok it produces the result below which contain top or maximum Sale amount of a product in a specific location and the sales rep related to the maximum sale amount in that location.
Conclusion
This post showed a basic Group By operation in Power Query. We’ve also seen that we can perform aggregation based on several columns and that the group by transformation is a very useful transformation technique in Power Query.