The number one issue facing data analyst when building robust and stable solutions has been accessing, cleansing and transforming the data but with the integration of Power Query into all the data analysis and business intelligence tools from Microsoft such as Excel, Power BI and Analysis Services, data accessing, cleansing and transformation has been made easy because Power Query is designed to be an easy to use data accessing, transformation and manipulation tool. In this post I will be illustrating how to clean and transform data using power query but instead of using the Power Query GUI I will be using the Advanced editor to write the M code. Before the cleansing and transformation I’ll assume you have been given a project to complete and as analyst you’ve define a clear measurable and quantifiable goal for the project, your audience have been identified and any other requirements are also met. You now have the required data for the project but you’ve seen that the data is in state not suitable for the analysis so you’ve decided to condition or transform the data to suit your analysis. Transforming the data to suit your analysis is a critical step in the data analysis process as it helps to ensure that the data is in a format that is suitable for analysis and modeling, and that it is free of errors and inconsistencies. A failure to transform the data to suit your analysis will result in producing faulty output as there is the popular saying among the data analyst community which state “garbage in, garbage out” which simply means “incorrect or poor input will produce faulty output”.
What is Data Transformation?
Data transformation is the process of converting, cleansing, and structuring data into a usable format that can be used for analysis and modeling. The goal of data transformation is to prepare the data so that it can be used to extract useful insights and knowledge. Data transformation include data cleaning, data integration, normalization, scaling, reduction, discretization, aggregation and many more.
Sample Data
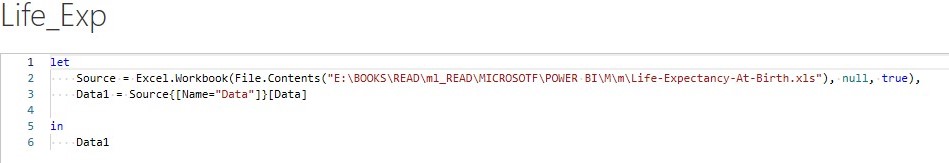
To work through the examples in this post, you need to download the data used in this post from Life-Expectancy-At-Birth.xls and load it into power query as shown below
![]()
Data Transformation
From the data above we can see that power query was not able to determine correctly the column headers of the data loaded. Looking at the data we can see that the actual column headers for the data is Row 1 but because power query could not determine it correctly, it labels the column headers as column1, column2 and in that order.
Promote Headers Operation
Sometimes the actual column headers of the table is the first row as seen above but because power query could not determine it correctly it labels the column headers incorrectly and this need to be corrected. With the promote headers operation, it promotes the first row of values as the new column headers. There are a number of places where we can select the promote headers operation (Use First Row as Headers )
Click on the Home tab then in the Transform group
Or On the Transform tab, in the Table group.
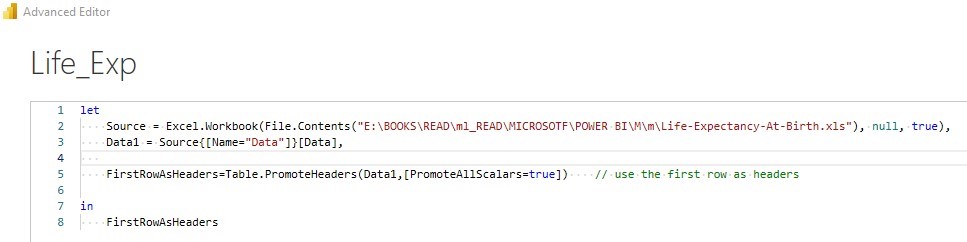
After clicking on Use First Row as Headers, the first row in the query is used as the column headers of the query but instead of clicking it I will write the M code using the Advanced Editor which can be located on the Home tab of the query editor. To open the Advanced Editor Click on the home tab then Advanced Editor as below
When the Advanced Editor is clicked it will opened an editor similar to one below
Using this editor I will use the M table function Table.PromoteHeaders to write a code named FirstRowAsHeaders promote the first row as Headers
and we get the table below
![]()
Remove columns
Remove columns is an operations that help you define what columns your table needs to remove. From the data the columns named Indicator Name and Indicator Code contain data not relevant to our analysis so we need to remove them. To remove these columns select the columns to remove, in our case the column Indicator Name and Indicator Code as below
![]()
then right click and select Remove Columns to remove the selected columns. Remove Columns can also be found on the Home tab in the Manage Columns group.
Instead of using the approach described above, let use the M table function Table.RemoveColumns to write the code named RemoveUnwantedColumns to remove the unwanted columns.
![]()
With the unwanted columns removed we now have the table shown below
![]()
Renaming Columns
To rename a column heading you can double click on the column heading start typing the new name but since we are writing the code, let use the Table.RenameColumns function to write the code named ColumnRenamed to rename the column Country Name to Country.
![]()
![]()
Unpivot columns
given a table like the one above, where the rows of the country and the date columns create a matrix of values, it’s difficult to analyze the data in a scalable way. In such cases we might want to unpivot or flatten the data, to put it in a matrix format where all similar values are in one column. To unpivot the table to have country, country code ,year and life Expectancy at birth as columns select the country and country code columns as below, then right click on the selected columns and select Unpivot Other Columns.
![]()
Instead of unpivoting using the approach described above, let use the m Table.UnpivotOtherColumns to write a code named UnpivotOtherColumns to unpivot other columns.
![]()
![]()
Transform Column Date Type
When using data for analysis you have to make sure the data type of the various columns are correct.
![]()
For instance we know that the Life Expectancy at birth (Life_Expentancy_At_Birth) column is a numerical column when we look at the data type of Life_Expentancy_At_Birth above, it is given as a text which is not correct so we need to change it to a numerical data type. Using the Table.TransformColumnTypes function the code below named ChangeDataType change the Life_Expentancy_At_Birth data type from text to a numerical data type
![]()
![]()
Sorting
Let sort the data in ascending order based on the Year column. The sorting is given by the code below named SortYear using the Table.Sort function
![]()
![]()
Filtering the Data
From the data some countries such as Andorra, American Samoa etc, contain null values throughout, so we need to filter out such rows from the data. Since these nulls values are under the Life_Expectancy_At_Birth column, let filter the rows containing null under the Life_Expectancy_At_Birth column using Table.RemoveMatchingRows function to remove rows containing null
![]()
![]()